We begin as usual with the Romer Curve. It shows what she predicted now four years ago.
Above we have the prediction and reality. As we have noted for the past 4 years reality and the economists prediction never even come close.
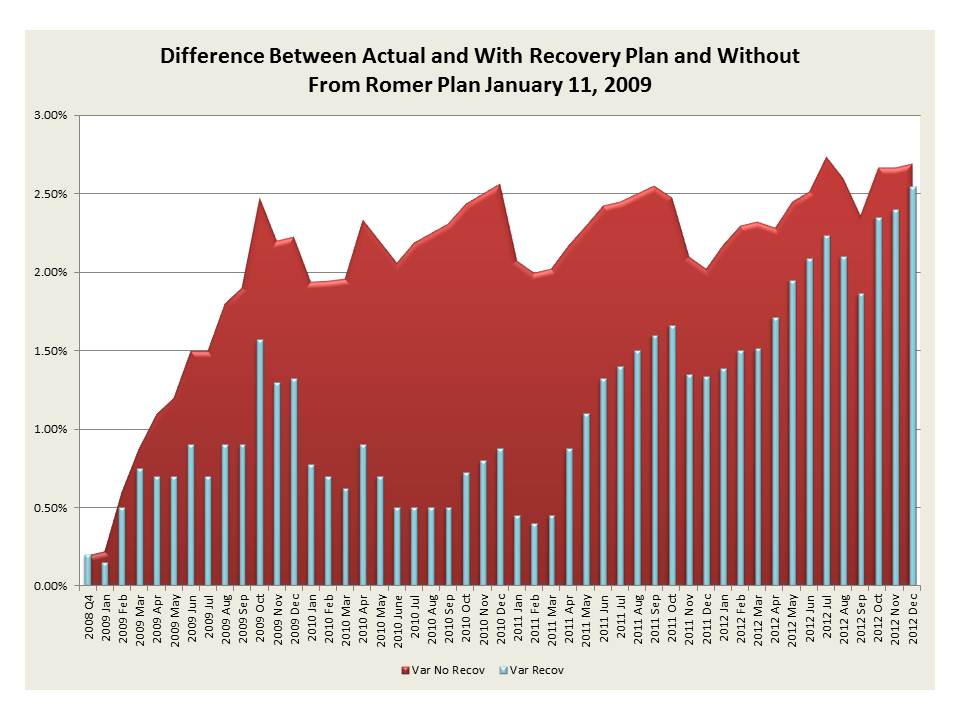
The above is the errors of the Romer curve. Note they just seem to get bigger.
This is unemployment based on DoL data on the reality of what was in the work force as of 2008, percent wise of population. We are still above 11% unemployment, or another way of saying we have a structural unemployment.
The above is the workforce as a percent of the population and the unemployed. We still have a substantial amount unemployed as of DoL but worse we have lost 2% of the population to systemic unemployment. That is growing and it is 2%+ of the total population. That is a main driver to the loss in tax revenues as well.
The above demonstrates that structural change. As the population grows we see the drop never closing.