First we look at change from 2005, April specifically. Note that we have an increase in percent of Government workers and a dramatic increase in Education and Health Care. The latter being the greatest increase. Key sectors such as construction and manufacturing are still down. This represents a negative shift from production to Government operated employment. This means we are taking from our long term growth potential and putting an ever growing burden on future generations.
This is the month by month change by major sector. Despite what the press seems to say the Government supported sectors rose significantly as did manufacturing.
The percent change from 2005 is shown above and this rearticulates our concern. Just look at the above sectors and those are the value producing sectors.
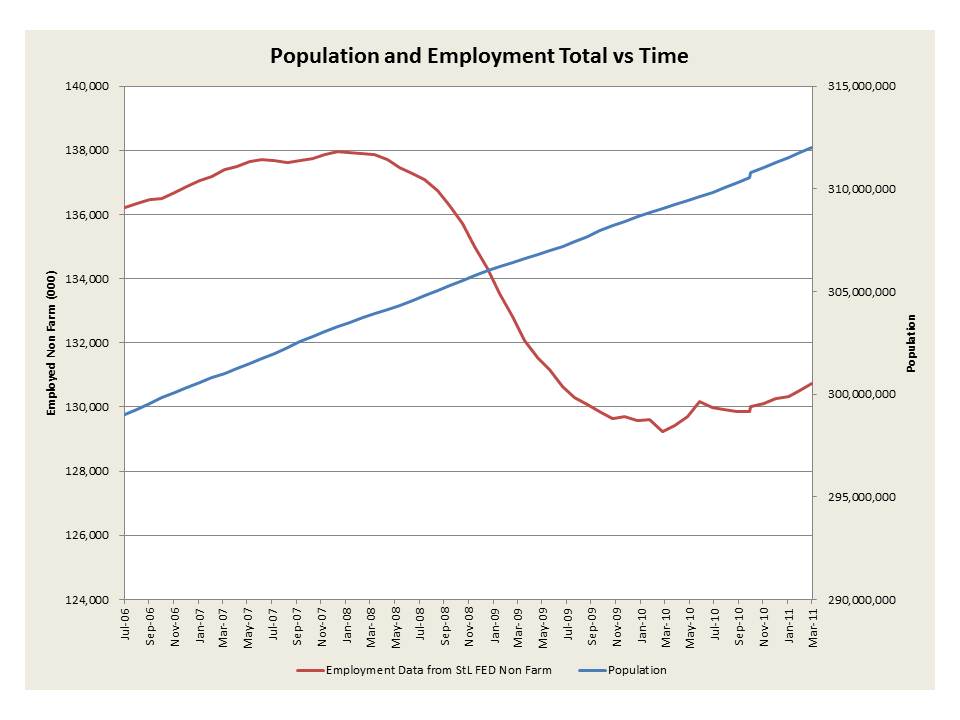
Now for actual unemployment we use what we have been using namely total population and actual growth. Above is the total population growth and the total non farm seasonally adjusted employment. It is upticking but the employment base is still growing at a faster rate!
This is the unemployment numbers and what is would be if we kept the 2008 rate of employment as a percent of the population. Note we are still peaking at 12.2% unemployment based on the 2008 base numbers. There is a slight trending downward but not as provided by DoL.
The above is the detailed data we use for this analysis.
In summary unemployment is fundamentally stuck at over 12% per 2008 base numbers. DoL manages to reduce the base by assuming that those who have not found work are considered no longer looking. It is a nice trick but baseless.